Customize Consent Preferences

We use cookies to help you navigate efficiently and perform certain functions. You will find detailed information about all cookies under each consent category below.

The cookies that are categorized as "Necessary" are stored on your browser as they are essential for enabling the basic functionalities of the site. ... 

Always Active

Necessary cookies are required to enable the basic features of this site, such as providing secure log-in or adjusting your consent preferences. These cookies do not store any personally identifiable data.

No cookies to display.

Functional cookies help perform certain functionalities like sharing the content of the website on social media platforms, collecting feedback, and other third-party features.

No cookies to display.

Analytical cookies are used to understand how visitors interact with the website. These cookies help provide information on metrics such as the number of visitors, bounce rate, traffic source, etc.

No cookies to display.

Performance cookies are used to understand and analyze the key performance indexes of the website which helps in delivering a better user experience for the visitors.

No cookies to display.

Advertisement cookies are used to provide visitors with customized advertisements based on the pages you visited previously and to analyze the effectiveness of the ad campaigns.

No cookies to display.

GeoTools

Draw Rose Diagram/Stereonet: GEOL_ROSEDIAGRAM – GeoTools Command

Summary

The GEOL_ROSEDIAGRAM command in GeoTools enables users to create Rose Diagrams and Stereonets for analyzing dip-strike orientations, making it an essential tool for structural geologists, geotechnical engineers, and GIS professionals in BricsCAD, AutoCAD, ZWCAD and ARES Commander.

GeoTool -> Geological/Mining Tools -> Dimensional Stone -> Draw Rose Diagram/Stereonet

Draw Rose Diagram/Stereonet: GEOL_ROSEDIAGRAM – GeoTools Command

Key Features Include:

  • Multiple Rose Diagram Types:
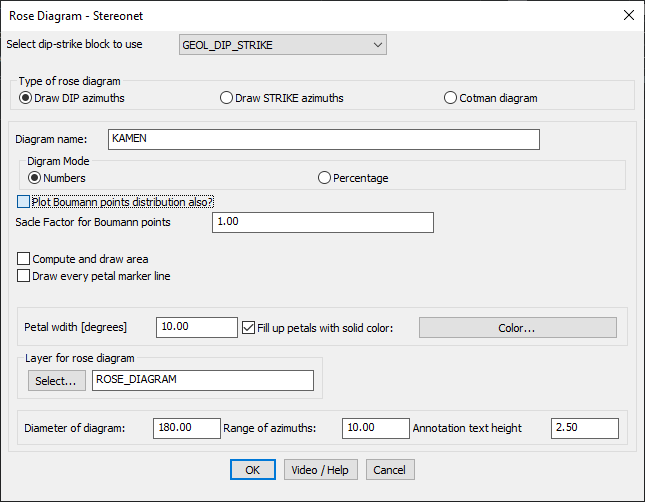
    • Draw DIP azimuths – Visualize the dip direction of geological structures.
    • Draw STRIKE azimuths – Represent strike orientations of rock formations.
    • Cotman diagram – Alternative method for stereonet visualization.
  • Customizable Diagram Settings:
    • Assign a diagram name for easy reference.
    • Choose between Numbers or Percentage for data representation.
  • Advanced Geological Data Integration:
    • Option to plot Boumann point distribution for statistical analysis.
    • Apply a Scale Factor for Boumann points to refine visualization.
  • Graphical Enhancements:
    • Adjust petal width (in degrees) for detailed representation.
    • Enable solid-colored petal fill for clarity and better visualization.
    • Compute and draw the total area covered by the rose diagram.
    • Option to draw marker lines for each petal for enhanced readability.
  • Layer & Display Controls:
    • Assign a specific CAD layer for the rose diagram (e.g., “ROSE_DIAGRAM”).
    • Define diagram diameter, azimuth range, and annotation text height.

Benefits:

This tool is highly useful for structural geology, fault analysis, and directional data representation, allowing users to visualize geological trends effectively for interpretation and decision-making.

Leave a Comment

Your email address will not be published. Required fields are marked *